
How Much Dog Poop Is Actually on NYC Sidewalks? I Counted.
There are few things more obvious than the gratitude of thousands of New Yorkers soaking up the much-needed sunlight after a dreadful winter.
During the uncharacteristically warm few days in early March, I spent two full days biking and walking 60+ miles across fifteen neighborhoods, enjoying the sun. Also?
I was counting dog poop.
A recent article from the Gothamist garnered attention with a proclamation that dog poop data revealed the ‘city’s crappiest block,’ home to the worst dog poop problem. While I applaud the awareness and conversation the piece created, the data used to crown the crappiest block isn’t complete. It was based on 311 data, essentially the number of complaints, not actual dog poop on the sidewalk.
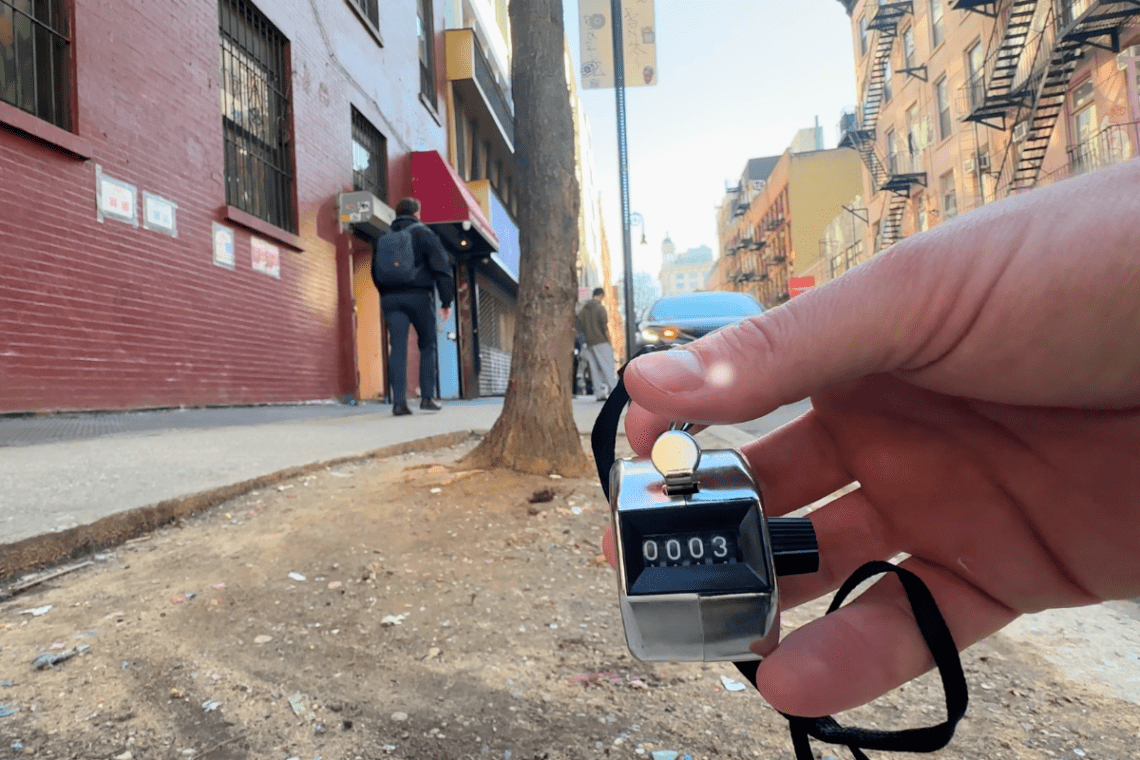
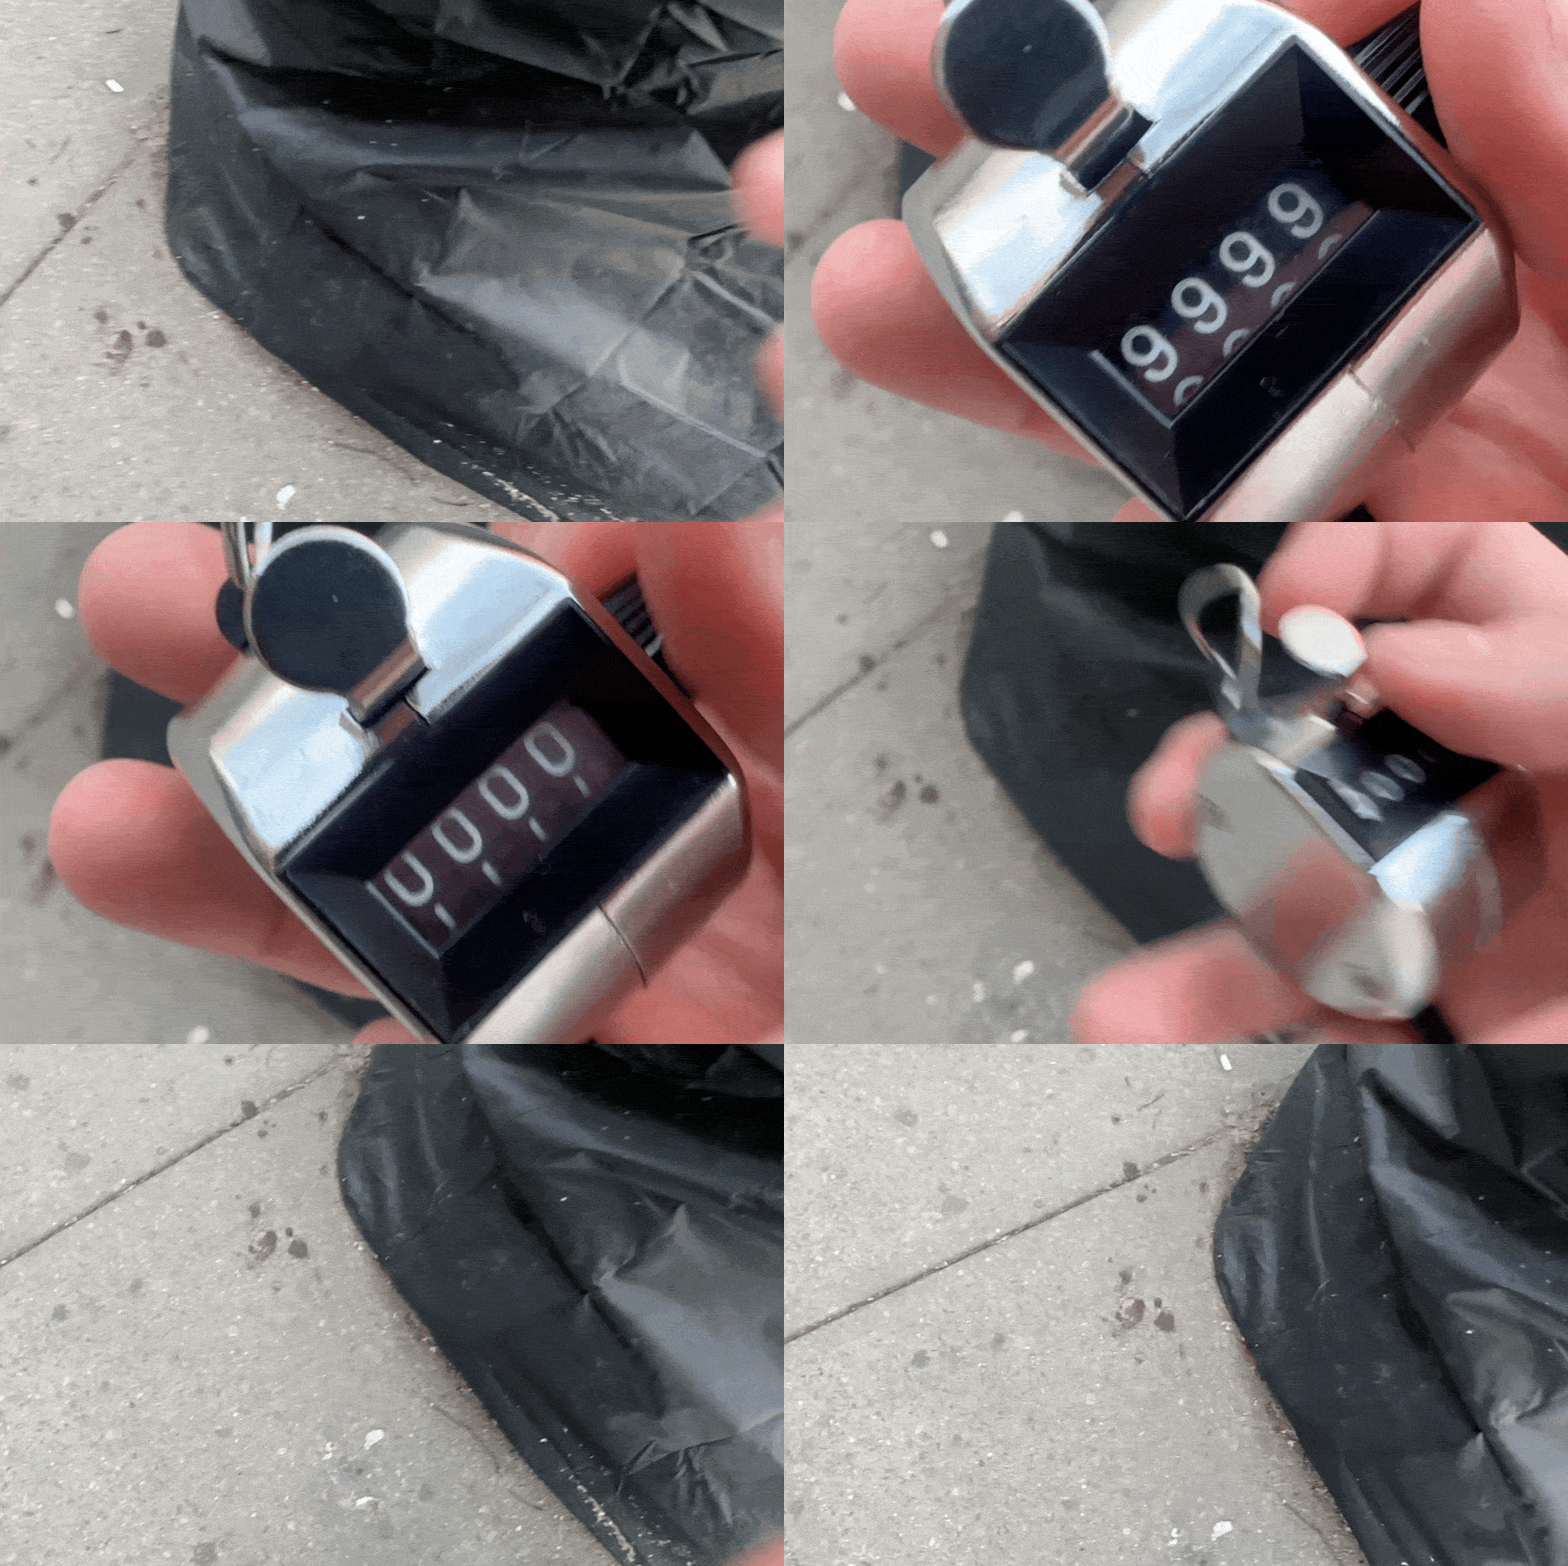
So, I set out with a tally counter, fifteen neighborhoods’ worth of 1,000 feet of varied sidewalk, and a spreadsheet ready to be filled with the scoop on the poop.
Table of Contents:
- 15 neighborhoods
- 311 data
- Field data
- 311 & field compared to dog density
- Worst neighborhood verdict & full interactive map
- What can we do?
Note #1: This article was written by a real human who lives in NYC, not artificial intelligence. 🥸
Note #2: All charts are interactive. So, be sure to click around to explore the data.
Article edited by Molly McCluskey.
The Scoop on NYC’s Dog Poop
The Gothamist relied on 311 (the city’s non-emergency “complaint line”) data to analyze the crappiest blocks in the city. When someone sees dog poop and gets angry enough to report it, they can file a complaint online or by phone.
311 complaints aren’t the same as boots poop on the ground facts, but they often identify the most fed-up neighborhoods.
What we need is field data. Even then, it’s unlikely the data would be sufficient without knowing the dog population in each area. 5 grand larcenies in the town of Le Roy, Iowa (population of 11), is not the same as 5 grand larcenies on the Upper West Side (population around 230,346). We should apply that logic to dog poop.
For more accurate neighborhood dog poop rankings, I compared and analyzed based on three main factors:
- 311 data of dog waste complaints
- Actual dog waste on the streets
- #1 & #2 in relation to the number of registered dogs
Please review the raw data, relevant methodological notes, and rules at the end of the article.
But first, the neighborhoods.
15 Neighborhoods
15 neighborhoods of counting is a tiny sliver of New York City. However, I’m just a guy with a tally clicker. Rest assured, I plan to count more neighborhoods in the future.
Choosing Neighborhoods
The neighborhoods I chose to canvass were influenced by factors such as 311 data, online comments with very strong claims, and the overall sentiment around potential top offenders. Not perfect, but a start.
Below are the 15 neighborhoods covered in the field data:
- Sunset Park (Brooklyn)
- Washington Heights (Manhattan)
- Flatbush (Brooklyn)
- Bushwick (Brooklyn)
- Crown Heights (Brooklyn)
- Chelsea (Manhattan)
- Astoria (Queens)
- Upper East Side (Manhattan)
- Upper West Side (Manhattan)
- Hell’s Kitchen (Manhattan)
- Harlem (Manhattan)
- FiDi (Manhattan)
- Lower East Side (Manhattan)
- Park Slope (Brooklyn)
- Greenwich Village (Manhattan)
Yes, yes, I know, I missed the Bronx and Staten Island. I will get there next time. 👍
Locations within Neighborhoods
Within each neighborhood, I chose 1,000 feet of sidewalk to tally. I canvassed both sides, totaling 2,000 feet.
This was the trickiest part of narrowing down where to count. It’s almost impossible to replicate an area as similar as possible across such a wide variety of neighborhoods.
My two main considerations:
- If it was mentioned in the Gothamist article, I went there.
- If it were a block I chose myself, I covered the highest-foot-traffic corridor in that neighborhood.
I know this introduces some bias in where poop was counted, but it’s a good starting point and adds invaluable data to the broader dog poop issue.
Okay, let’s look at the data. We’ll start with 311. 👇
Metric 1: The 311 on Dog Dung
While there are some small correlations between high 311 complaint counts and high observed field data counts, other neighborhoods show the opposite pattern.
What stuck out to me:
- Why in the world does Sunset Park have so many 311 complaints in 2026?
- FiDi just doesn’t care about dog poop… Is it because they’re just trying to leave the office by a reasonable hour?
- Washington Heights averages almost one complaint per day (more on that later)
This data is a great starting point, but it doesn’t reflect reality. If you’ve walked through Hell’s Kitchen, you KNOW you’re dodging poop with every other step. But there were only a total of three 311 complaints in 2025.
Here are the rankings based solely on 311 data for 2025 & 2026 (# of complaints in parentheses):
- Washington Heights (243)
- Flatbush (155)
- Sunset Park (76)
- Crown Heights (50)
- Harlem (48)
- Upper West Side (29)
- Lower East Side (29)
- Park Slope (26)
- Chelsea (24)
- Bushwick (22)
- Upper East Side (15)
- Astoria (11)
- Hell’s Kitchen (8)
- FiDi (3)
- Greenwich Village (3)
Metric 2: Observed Field Data of Pup Poop
We all deserve clean streets. I also believe that the loudest complainers are unlikely to reflect the reality on the ground.
So, I set out with a tally counter, spreadsheet, and the two most beautiful March days you could ask for.
What stuck out to me:
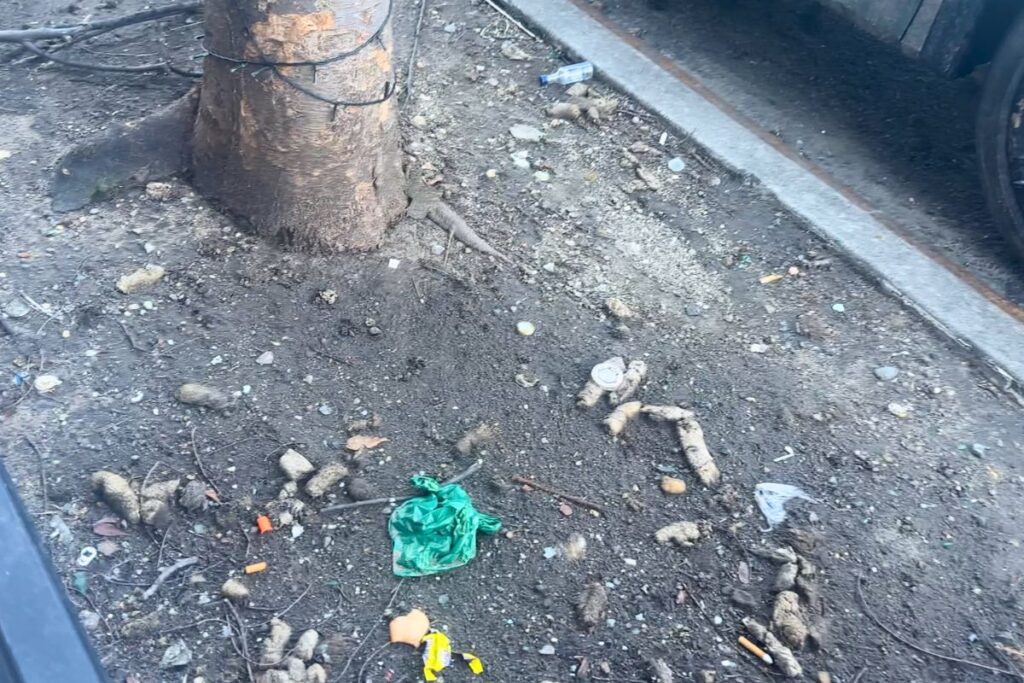
- I couldn’t believe what I saw in Washington Heights… tiny stretches of sidewalk had half a dozen poops.
- Every neighborhood has work to do.
You can’t tie dog poop problems to any identifier – income level, size of dog, race, religion, gender, breed of dog, average age of residents, etc. – It’s the great equalizer, unfortunately.
Rankings by observed field data from March 9-10, 2026 (# of dog waste counted in parentheses):
- Washington Heights (33)
- Park Slope (18)
- Upper East Side (14)
- Hell’s Kitchen (14)
- Greenwich Village (14)
- Sunset Park (8)
- Harlem (8)
- Chelsea (6)
- Bushwick (5)
- Lower East Side (5)
- Flatbush (4)
- Upper West Side (4)
- Crown Heights (3)
- FiDi (3)
- Astoria (3)
While some numbers seemed alarming, comparing the raw ranks to the per-dog rank shows that things change dramatically.
Metric 3: Doggie Density – THIS is the Key
The city says that the registered number of dogs in a given zip code represents only about 20% of the actual dog population. So, while the dog density factor isn’t a perfect metric, we’ll assume the ~20% registration rate holds across all zip codes in the city, giving us a level playing field.
For this research, I counted the number of dogs registered. I omitted licenses that expired after January 2020 to remove dogs that may have moved, passed away, etc.
Here are the number of registered dogs per neighborhood:
- Park Slope (8,821)
- Upper West Side (7,976)
- Chelsea (7,813)
- Greenwich Village (5,135)
- Lower East Side (4,731)
- Flatbush (4,444)
- Hell’s Kitchen (4,365)
- Harlem (3,387)
- Sunset Park (3,331)
- Upper East Side (3,325)
- Crown Heights (2,992)
- FiDi (2,982)
- Washington Heights (2,589)
- Bushwick (2,429)
- Astoria (1,957)
Now, let’s compare all previous metrics when weighted by per-dog rank.
Here are the rankings based on 311 data for 2025 & 2026, weighted by the # of registered dogs (raw 311 rank in parentheses):
- Washington Heights: 9.39 complaints per 100 dogs (1st)
- Flatbush: 3.49 complaints per 100 dogs (2nd)
- Sunset Park: 2.28 complaints per 100 dogs (3rd)
- Crown Heights: 1.67 complaints per 100 dogs (4th)
- Harlem: 1.42 complaints per 100 dogs (5th)
- Bushwick: 0.91 complaints per 100 dogs (10th)
- Lower East Side: 0.61 complaints per 100 dogs (7th)
- Astoria: 0.56 complaints per 100 dogs (12th)
- Upper East Side: 0.45 complaints per 100 dogs (11th)
- Upper West Side: 0.36 complaints per 100 dogs (6th)
- Chelsea: 0.31 complaints per 100 dogs (9th)
- Park Slope: 0.29 complaints per 100 dogs (8th)
- Hell’s Kitchen: 0.18 complaints per 100 dogs (13th)
- FiDi: 0.10 complaints per 100 dogs (14th)
- Greenwich Village: 0.06 complaints per 100 dogs (15th)
The number of complaints per dog ranking doesn’t vary much. The real variance comes when we compare the raw rank of field counts vs. the per-100-dogs ranking of field counts.
Here are the rankings based on observed field data weighted by the # of registered dogs (raw field rank in parentheses):
- Washington Heights: 1.27 poops per 100 dogs (1st)
- Upper East Side: 0.42 poops per 100 dogs (tied 3rd)
- Hell’s Kitchen: 0.32 poops per 100 dogs (tied 3rd)
- Greenwich Village: 0.27 poops per 100 dogs (tied 3rd)
- Harlem: 0.24 poops per 100 dogs (tied 6th)
- Sunset Park: 0.24 poops per 100 dogs (tied 6th)
- Bushwick: 0.21 poops per 100 dogs (tied 9th)
- Park Slope: 0.20 poops per 100 dogs (2nd)
- Astoria: 0.15 poops per 100 dogs (tied 13th)
- Lower East Side: 0.11 poops per 100 dogs (tied 9th)
- FiDi: 0.11 poops per 100 dogs (tied 13th)
- Crown Heights: 0.10 poops per 100 dogs (tied 13th)
- Flatbush: 0.09 poops per 100 dogs (tied 11th)
- Chelsea: 0.08 poops per 100 dogs (8th)
- Upper West Side: 0.05 poops per 100 dogs (tied 11th)
While some neighborhoods posted similar rankings, some were VASTLY different when normalized to the number of dogs in the neighborhood.
The data show that we cannot rely on 311, or even field data, alone. Instead, normalizing both by the number of registered dogs in a given area gives us the most complete picture.
Tying It All Together – The Sh*ttiest Slice of Sidewalk
Now that I’ve gathered the field, 311, and per-dog-density metrics, I can crown the shittiest slice of sidewalk in NYC. 🏆
1st (and, really, worst) Place: Washington Heights
Washington Heights is the worst offender for dog poop in New York City, bar none. #1 in 311 complaints, 311 complaints per 100 dogs, observed poop, and observed poop per 100 dogs.
I reached out to District 10’s city council member, Carmen De La Rosa, and received this response from the council member’s spokesperson:
“We have done popular PSA’s as you might have seen (seems like other neighbors are fed up, too!), and we have spoken to several agencies to look into legislative solutions and different community engagement options. The current law, informally known as the Pooper Scooper Law, is notoriously hard for the Department of Sanitation to enforce. In the meantime, we want to find other creative ways to encourage our neighbors to take care of our outdoor spaces because we share them — it’s part of our quality of life and part of improving health conditions Uptown.“
2nd Place: Upper East Side
I set out on this research with an open mind, but I had a hunch that 311 complaints would not be indicative of observed waste on the streets. The Upper East Side proved my hypothesis.
It was covered in dog deposits, despite being low on the list of 311 complaints.
3rd Place: Hell’s Kitchen
Hell’s Kitchen’s 311 complaints are extremely low, only 3 in all of 2025.
But during my tally, I found 14 counts of dog waste in only 2,000 feet. Yikes!
Honorable Mention: Park Slope
I counted 18 dog poops in Park Slope, the 2nd most in my observations. Disgusting.
This neighborhood missed the top 3 only because it had the most dogs on our list, leading to a lower poop-per-100-dogs rating.
For what it’s worth, that doesn’t make dancing around dog shit any less awful.
Gothamist’s Proclaimed Worst Neighborhood Takes 5th: Sunset Park
When we conduct a more complete analysis using field data and per-100-dog comparisons, Sunset Park ranks 5th, not 1st. No shame on the Gothamist article or writer, but it shows how much we need the field data.
The Real Loser? Everyone. And Their Dogs.
Every neighborhood has AT LEAST three deposits.
When we neglect to pick up dog poop, aside from the health hazards, we create distrust in dog owners… ALL dog owners. Not picking up your dog’s poop is a sign that you may not care enough about dogs and their overall place and well-being in society. Because when you leave their poop on the street, you create distrust between neighbors and foster animosity in the community.
As this problem grows, dog folks are losing goodwill. What happens when that goodwill dries up?
If we dog owners aren’t careful, the next proposed dog run, for example, is gonna face stronger opposition for approval.
Can We Solve the Dog Poop Problem in NYC?
Communities and cities have tried damn near everything, including a Spanish city sending the feces back to the offending dog owners, to reduce the dog poop problem.
DNA Testing
In housing complexes and even entire (small) cities like Bolzano, Italy, owners are required to gather a DNA sample for their dog. Then any poop left on the streets or sidewalks is matched to DNA, and the associated owner is fined.
The press secretary of NYC’s Department of Sanitation (DSNY), Vincent Gragnani, said this is not a consideration for the city.
Even if it were considered, we can only get roughly 20% of dog owners to register their dogs, so a DNA test seems impossible.
Public Shaming
Some concerned neighbors have started photographing negligent owners and putting posters up around the neighborhood and on places like Reddit.
I’m generally against public shaming, but I think I could make an exception for dog-poop leavers.
311 Complaints
The data show that 311 complaints do nothing, with one caveat.
“All 311 complaints related to dog waste are investigated daily. And we do issue summonses to property owners for dirty sidewalks — 5,929 this calendar year alone,” said Gragnani.
As for fines for offending dog owners, the odds are essentially 0%, since they have to see the offender in the act of leaving poop behind to issue a summons.
Week-long patrols by DSNY in 2025 yielded ZERO (0, nada, zilch) summonses.
Unexplored Options – Surveillance
Gragnani said, “We are […] exploring the use of mobile cameras to increase enforcement against these careless residents.”
He later clarified that there are no active plans to enact this, simply an exploration. Additionally, if it were to happen, it would be DSNY-specific cameras.
Final Thoughts
In the grand scheme, poop-covered sidewalks are a small problem. But streets and sidewalks are where we negotiate what kind of city we want to live in, one small decision at a time.
On those two warm March days, I logged over 60 miles, hoping to find an answer to a simple question: what neighborhood is actually the worst dog poop offender? I found it, and I also found that EVERY neighborhood has work to do.
Every uncleaned dog poop sends a signal: “I live here, but I don’t care enough to keep it clean.” And those tiny signals add up. And unfortunately, the thousands of smelly signals across city sidewalks are creating distrust and animosity toward all dogs and dog owners.
I believe most of us do care, and we can continue to work toward cleaner streets. File a 311 complaint. Contact your council member. Clean up after yourself and your dog, because if my 80-year-old neighbor who uses a walker can do it, so can you!
And if you see someone leave dog poop on the ground, say something.

Devin Stagg
Recovering LinkedIn troll constantly toeing the line between excessive coffee intake and taking a nap. Excelled in startup culture until he realized that's just corporate code for being undervalued and overworked. Now searching for the meaning of work life, behind a microphone.
Plus, my Google Maps organizational skills are 2nd to none. 😜


